
2017-2019
(The project is done, but distilling the concepts for a general audience is in progress…)
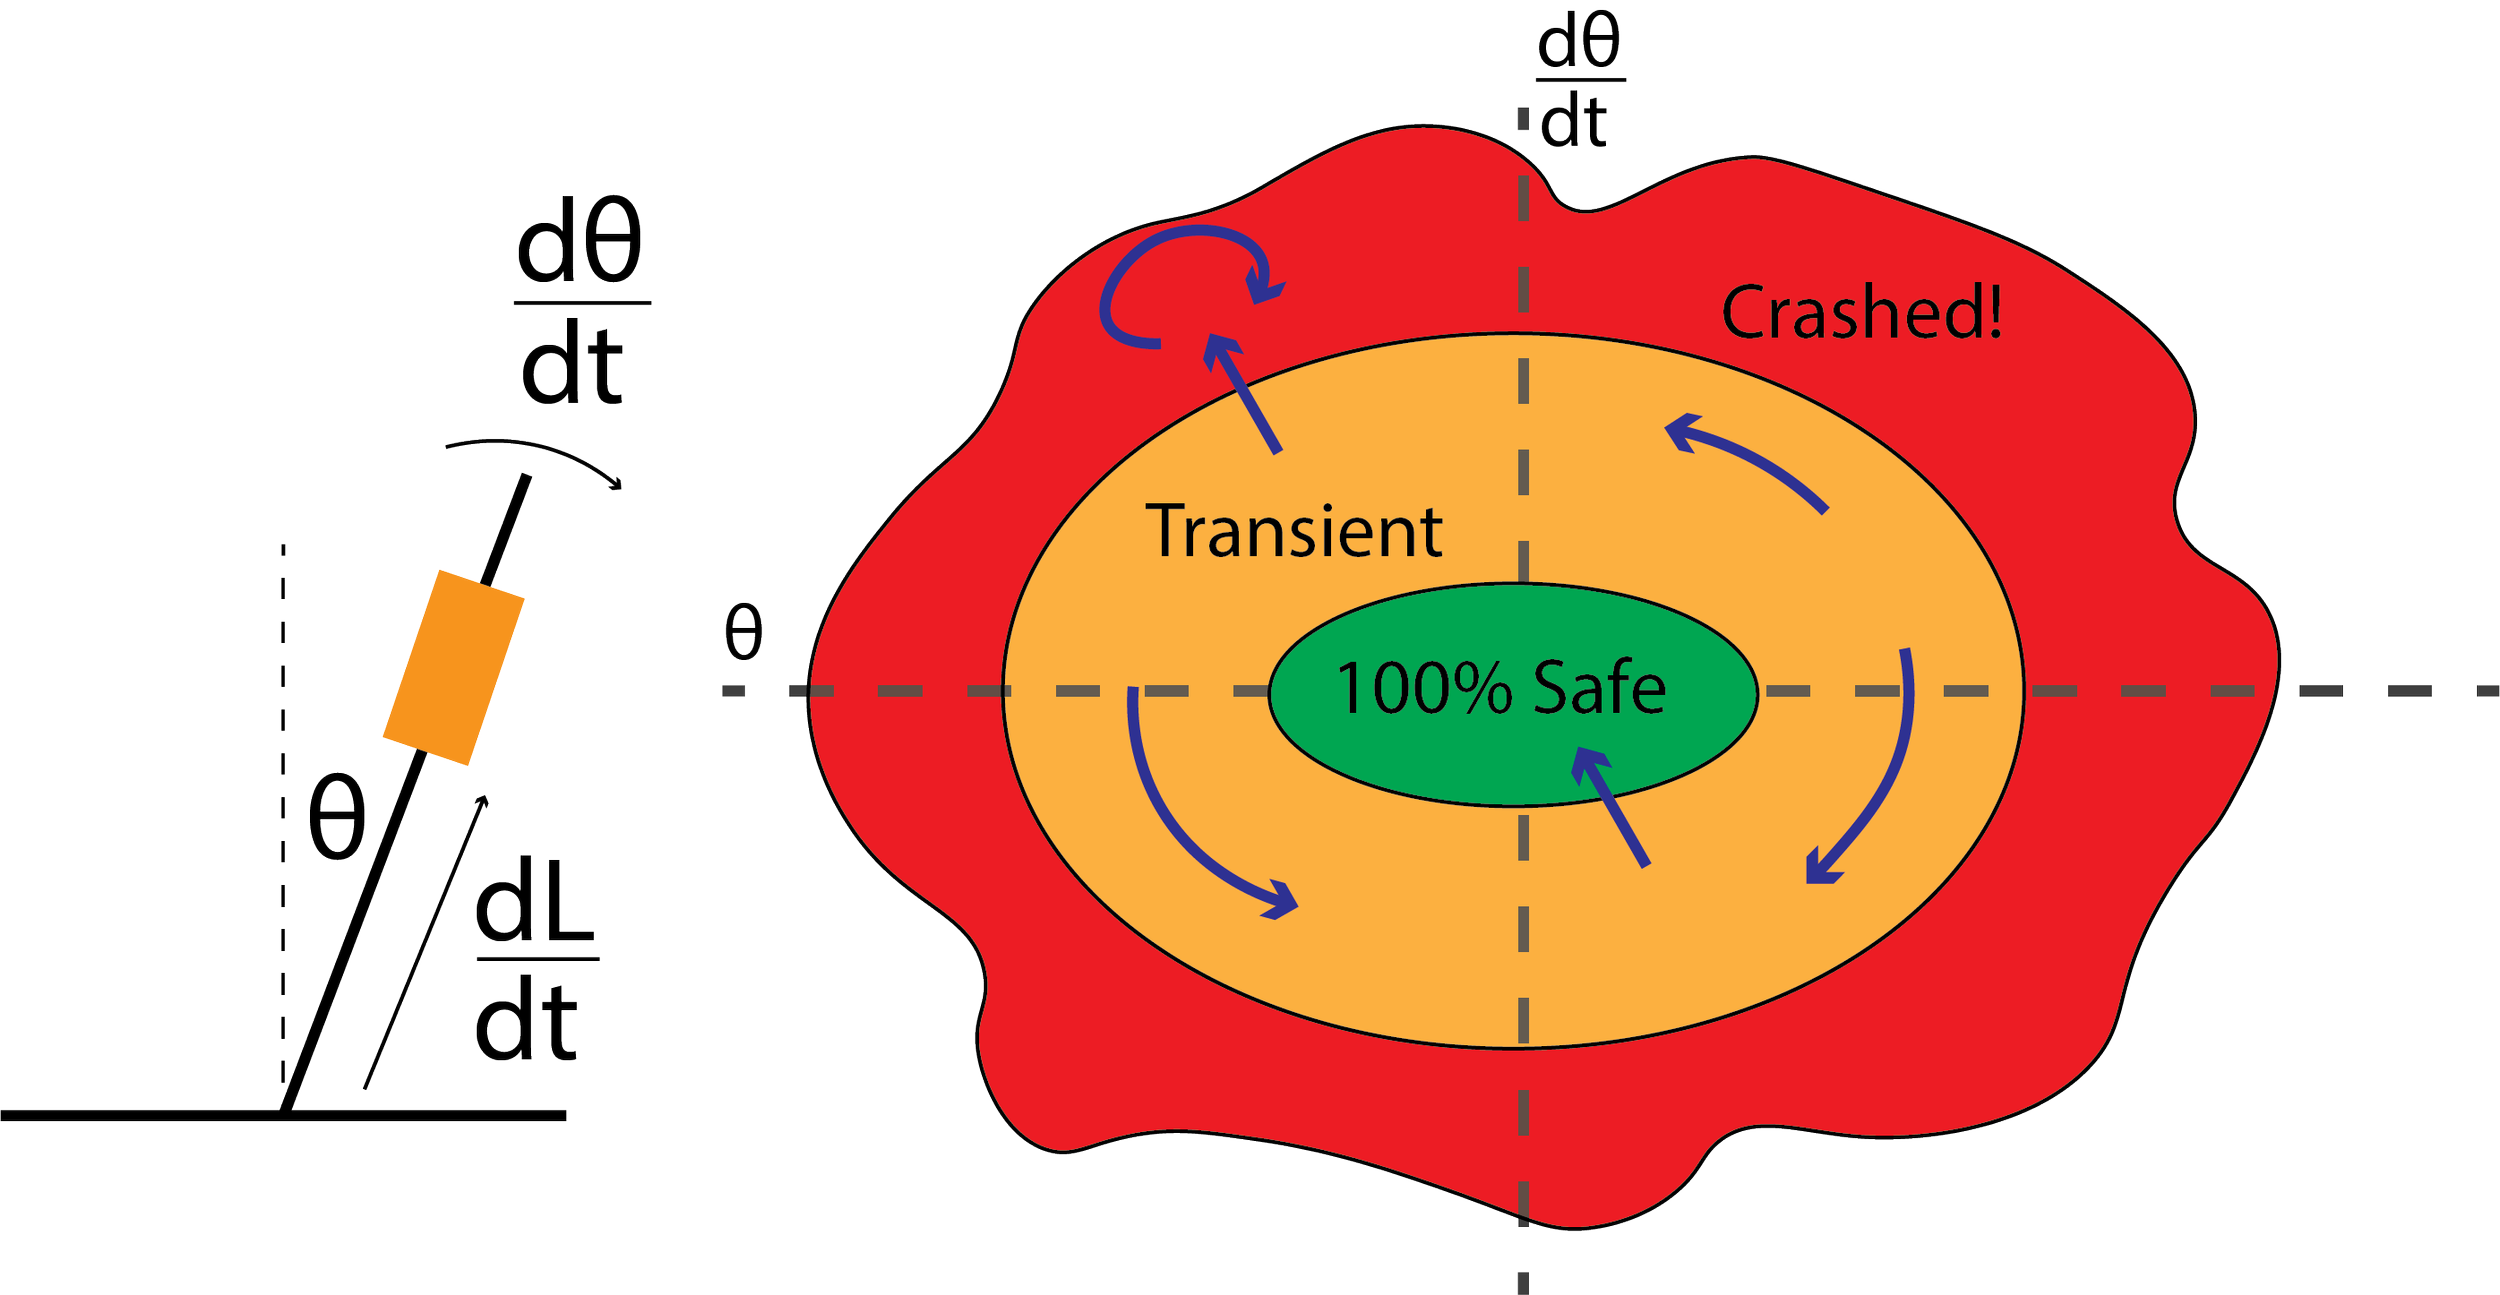
So you wanna keep your pogo-stick robot from crashing?
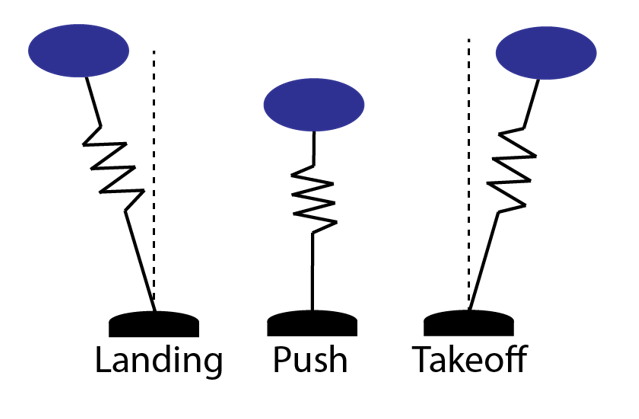
The Biomimetics Lab at MIT is interested in legged locomotion, and the simplest model for a thing that hops is the spring-loaded inverted pendulum. This model works extremely well as long as a small angle approximation holds. We took personal offense to the disregard of large angles, and we aspired to create a path planner and controller that threw out any assumptions about small angles and could give you a “safe” trajectory if one exists.
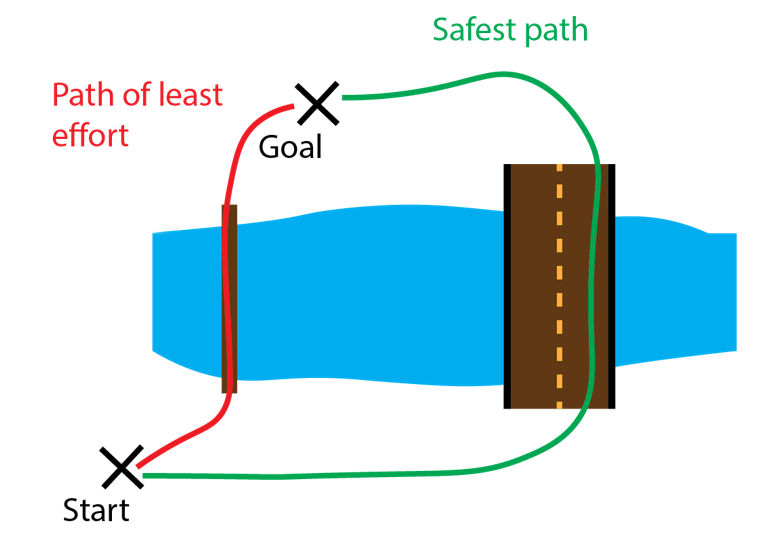
How do you quantify risk on a trajectory? Our first important observation was that risk depends on both intrinsic (independent of the particular trajectory) and extrinsic factors (directly relating to the particular trajectory or the environment). We focused our research developing an intrinsic model of risk.
Quick Math Review
The canonical “Drunkards walk” Absorbing Markov Chain, developed as a model that every student could understand.
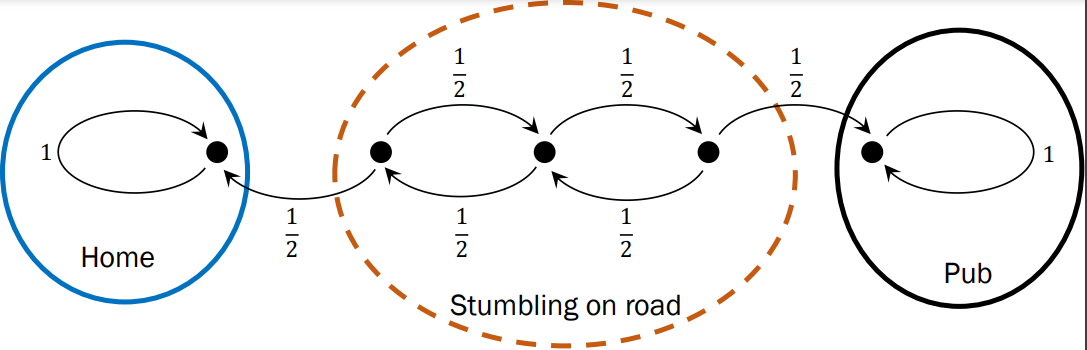
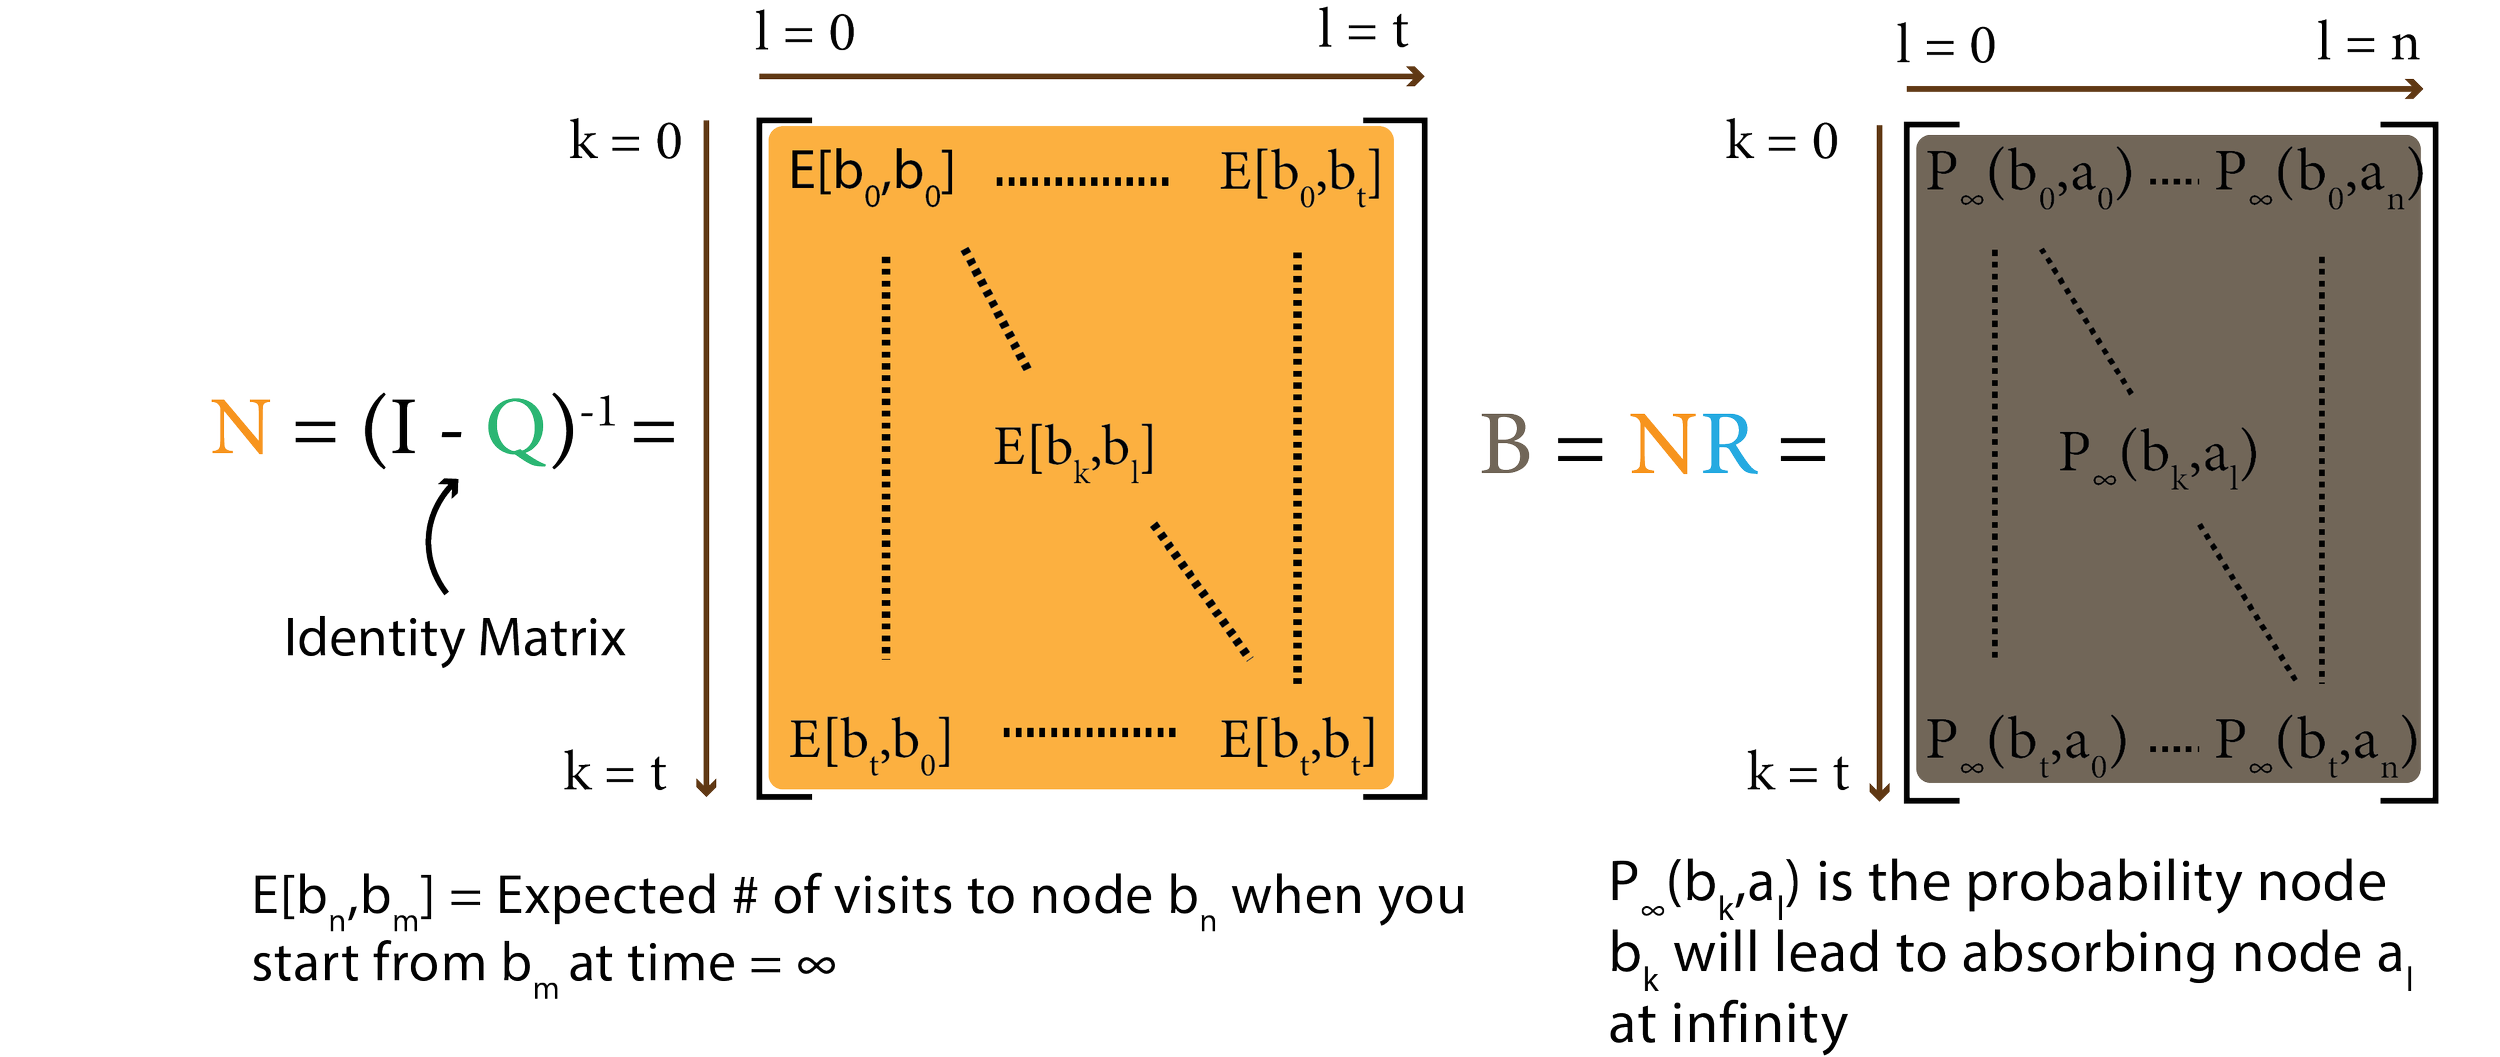
As a refresher, an absorbing markov chain is a directed graph where edge weights are probabilities of transitioning between the two nodes connected by the edge. Nodes are characterized as “transient” or “absorbing”. Absorbing nodes have no outgoing edges, and every transient node has at least one path to at least one absorbing node. With some clever matrix algebra, for each transient node, we can determine the probability of attaining each absorbing node.
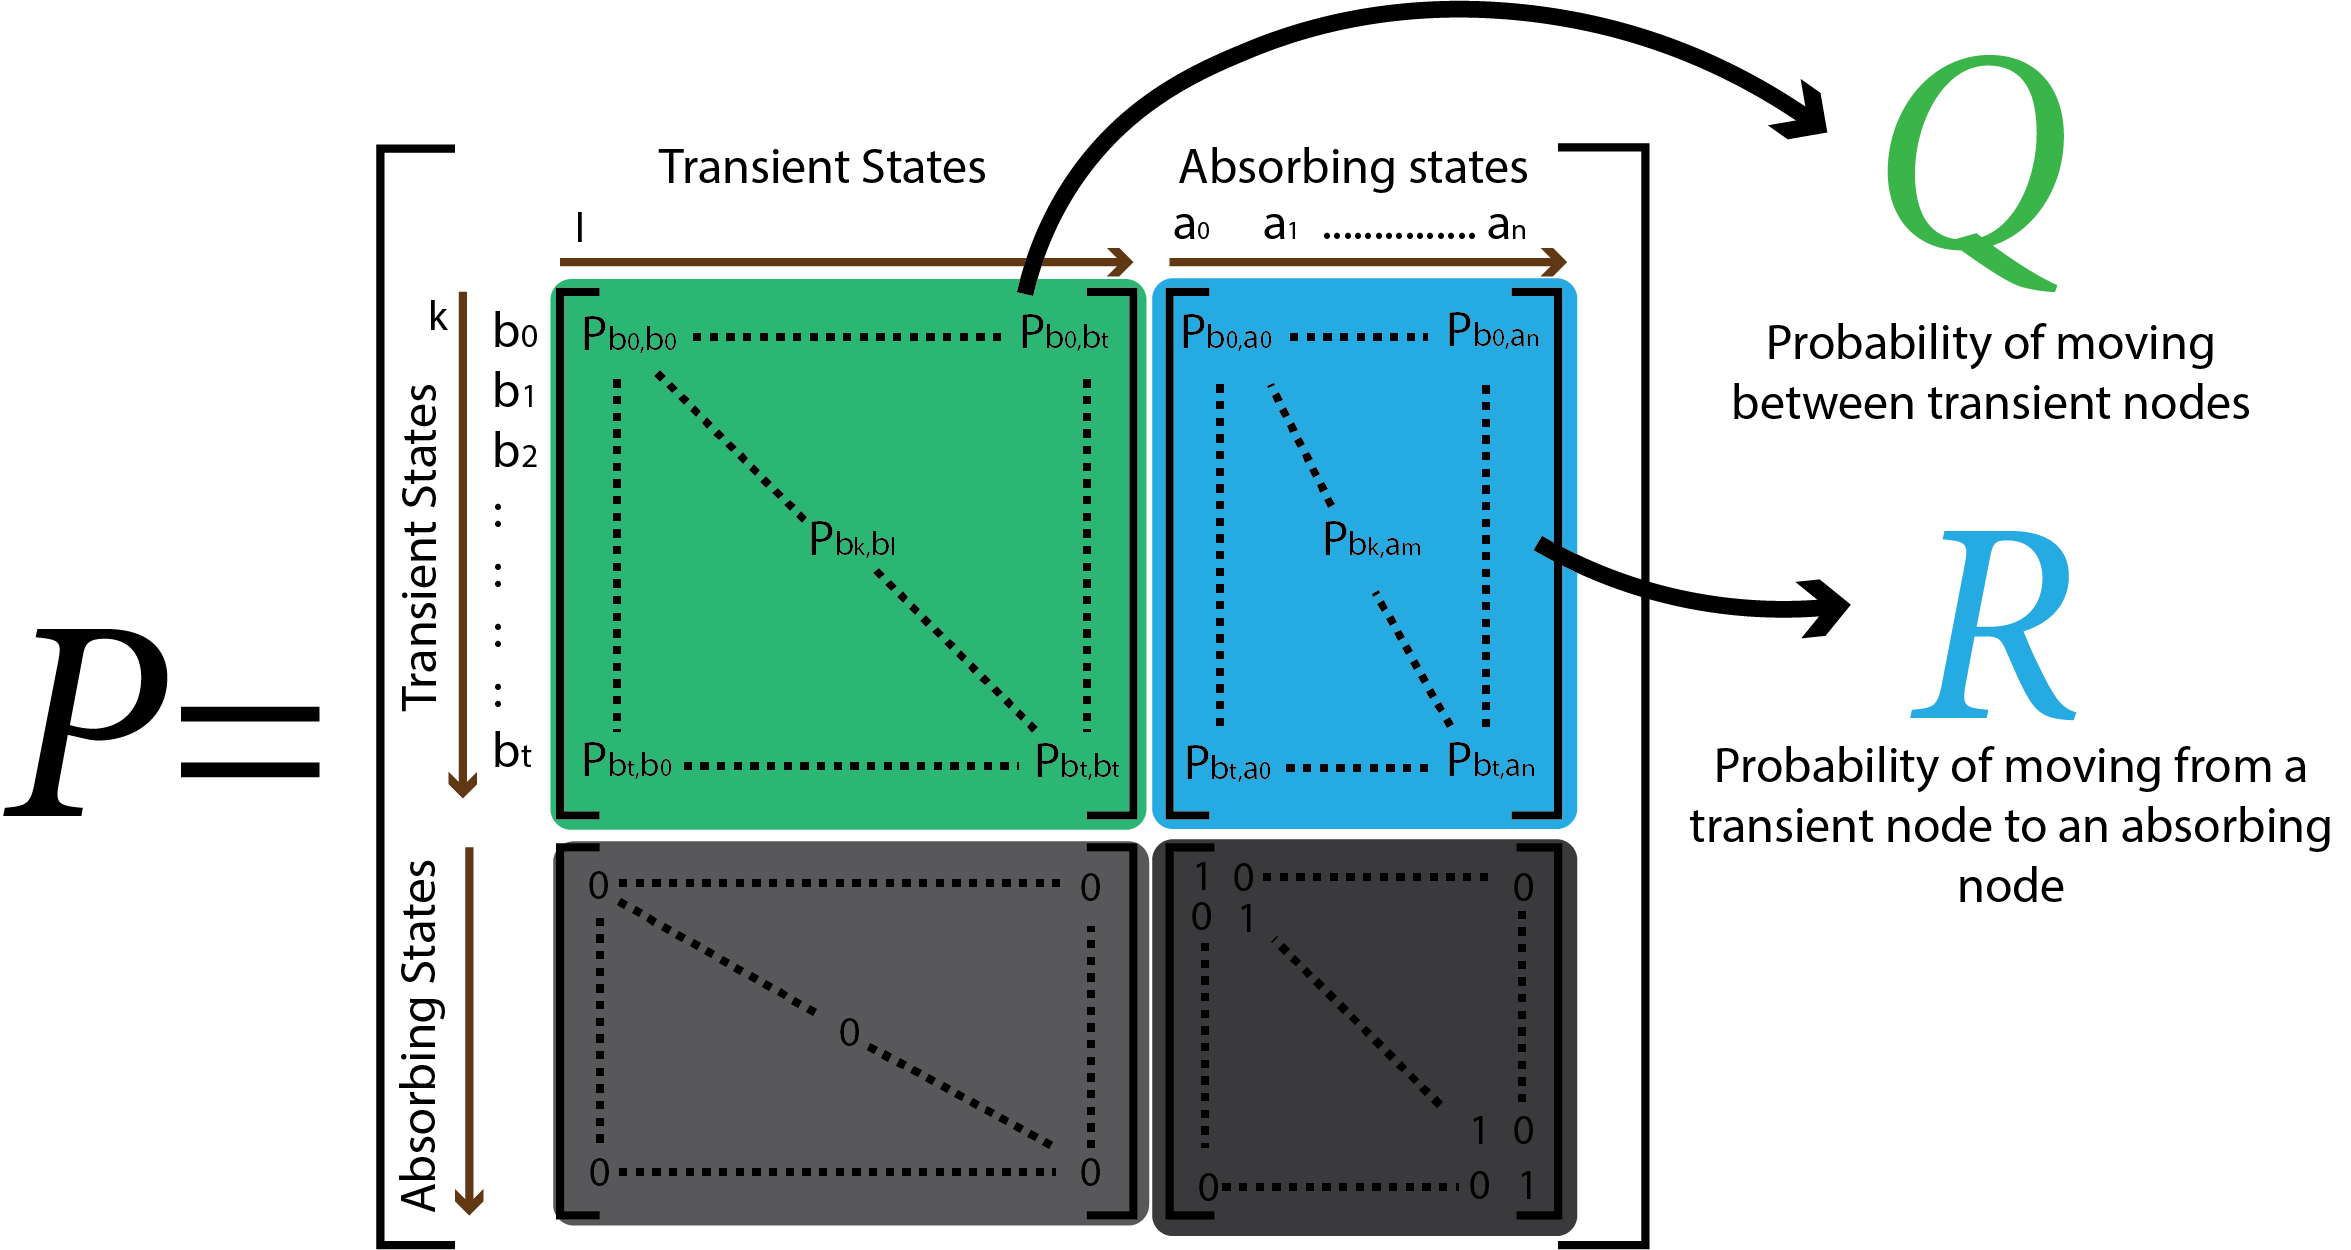
A Markov chain is fully represented by the composite matrix P, containing Q and R; the transition matrix of transient nodes to themselves and of transient nodes to absorbing nodes. By manipulating the matrixes Q and R, we can learn about the behavior of the graph’s random walks.
So…. how do we connect Absorbing Markov Chains to a pogo-stick robot?
Enter: Risk Network
Step 1: Define the graph
Consider a graph where a node represents the pogo-stick’s takeoff state, and an edge is a control action.
Nodes are discretized takeoff states.
Edges are control actions
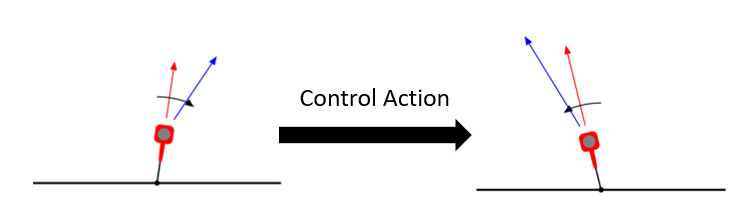
BOOM! Graph.
Because each node represents a state for the robot, they can be arranged with 3 dimensions: angle, angular speed, takeoff speed.
The astute among you might be saying “Hold the phone, you’re making a whole boatload of assumptions that need justification! How is this ever going to work???”
You’d be right. There are a lot of intricate details to building a graph that actually means anything, and I’m deciding to leave those out. Mark my words: it took my advisor and me about 6 months to nail down the details to the point that we where able to get useful results from this model.
Also…It really only works in the lovely world of simulation. It’s a wonderful exploration of a system’s properties and dynamics under ideal conditions. It made us think about how humans encode risk avoidance into automatic movements, and what this mathematical structure was telling us about the set of states this robot inhabits.
Step 2: Build the Graph
There are obviously an infinite number of possible states the robot could occupy, so we had to discretize somehow.